GPS Variation Study
Using a fixed point antenna, watch the GPS signal wander over the course of one month.
Dwayne Esterline
6/29/20241 min read
Using a fixed point antenna, I recorded the GPS signal over the course of several months.
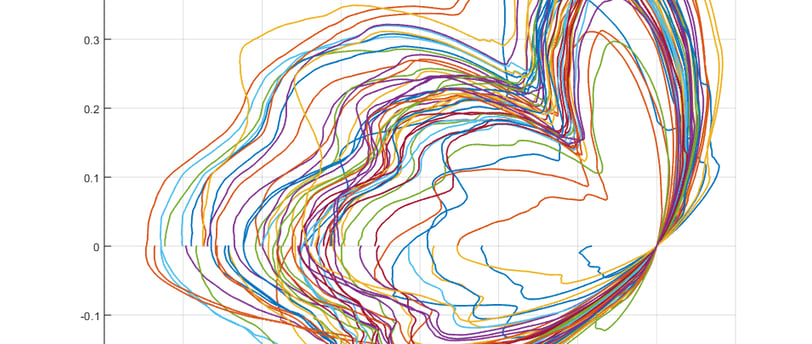
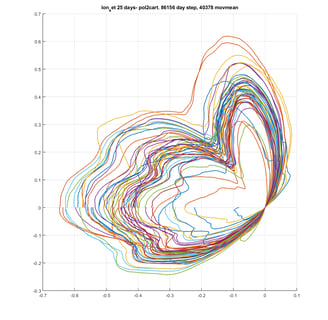
The image above is a polar plot reflecting 25 days worth of longitude data, mapped to earth rotation angle.
Similar types of periodic behavior are visible in the longitude component, though not in phase with longitude. I did not complete a study of the altitude data, as I failed to log it during the study (Duh!).
Look under the projects tab for more plots.
Investigate Explore Imagine
© 2024. All rights reserved.