Our projects
Anisotropic Probabilities
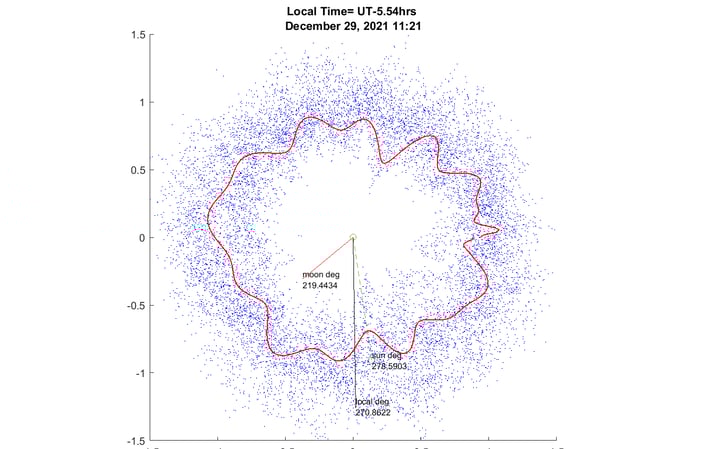
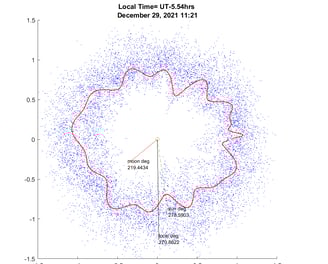
The image to the left is a 24hr polar scatterplot from the D101 device. The blue points are actual measurements, while the red line is a best fit trendline.
Many hundreds of these have been examined in order to visualize trends and patterns that exist.
The space around us is a dynamic, ever changing place. There are repeating patterns, and a mind boggling number of unexplained things.
Browse the list of projects on the menu dropdown above.
Investigate Explore Imagine
© 2024. All rights reserved.