Gravitational Modulation of D101 device frequency Vs Lunar Position
Mapping Device 101 frequency output against lunar declination and earth rotation angle provides some interesting insight into the gravitational field.
5/8/20241 min read
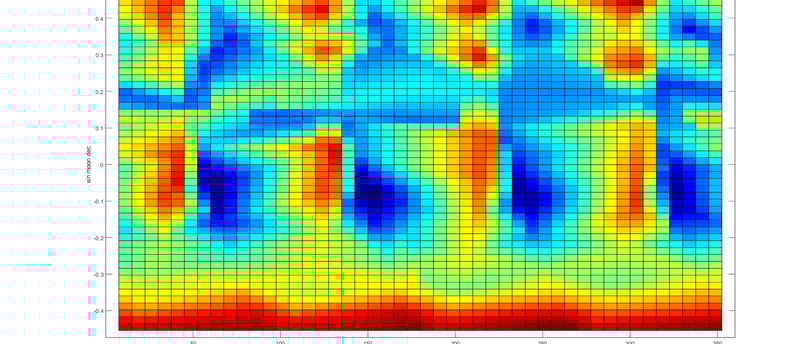
The image above represents a map of device frequency variation (D101) over a one month period, mapped to Local Apparent Sidereal Angle (x -axis) and the sine of moon declination angle.
To better understand the image, imagine it being projected onto the sky, wrapping all the way around the earth, and fixed in space against the background stars.
For a given moon declination (y-axis), as the earth rotates through the day (x-axis), the device registers small scale frequency modulations (on the scale of +- 2E-12 Hz).
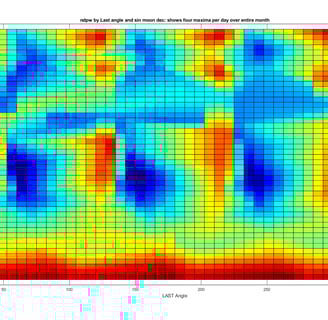
This image demonstrates a daily periodic frequency shift. While the moon at or slightly below zero declination, we measured a clear periodic effect, demonstrating four maxima and minima per earth rotation.
As the lunar angle moves through the course of the month, we see multiple transitions and interesting modulation.
To achieve this level of resolution over a long time period, I had to thermally isolate the device, as well as provide very pure electrical power.
Investigate Explore Imagine
© 2024. All rights reserved.