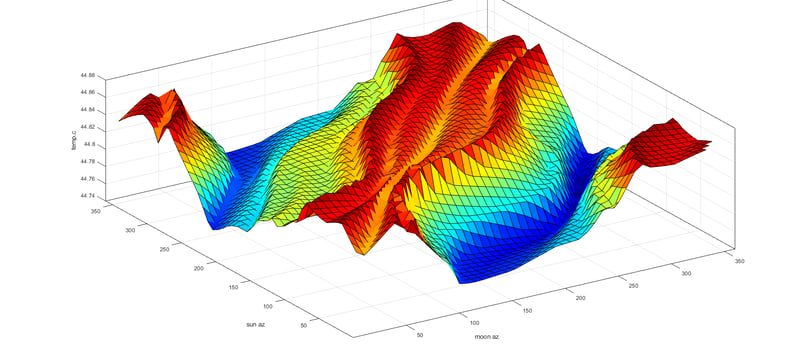
Temp sensor modulation-vs. lunar and solar azimuth
Modulation of a thermally isolated temperature sensor mapped to solar and lunar azimuth.
Dwayne Esterline
6/27/20242 min read
This result made me scratch my head a bit.
The image represents 30 days of temperature readings from a thermally isolated temperature sensor at the core of experiment D101. The total temperature range depicted is on the order of 0.12C (z-axis), which is mapped against the azimuth angle of the moon (x-axis) and the sun (y-axis).
The data-set selected for this image includes data before, during and after the earth/moon/sun combination are aligned in syzygy (roughly in a straight line- see wiki article here).
To better understand, choose any position on the moon azimuth (x-axis) and follow a 45 degree diagonal across the chart up the sun azimuth(axis-y) and up the moon azimuth (x-axis) simultaneously. The line you trace represents one rotation of the sun, and the passing of one day. A cross section of the chart along your line would show the temperature modulation during one day.
Any straight line at a 45 degree angle, with an origin on x or y axis, tilted toward an increase in that axis, is representative of the direction of time passing during that day. For example, if we draw a line with origin 100 deg on the moon axis(x) and 0 deg on sun axis, and then proceed at a 45 deg angle until we intersect 300 deg on the moon axis, we would be at the intersection of 200 deg on the sun axis. This particular line corresponds with the coolest temperatures, as indicated by the blue valley on the chart.
Maximum temperatures are coinciding with lunar and solar azimuth being aligned, not necessarily when the sun is high in the sky (when we would expect the warmest temperatures). While the lowest temperatures are corresponding with the moon and sun being in approximate opposition.
The symmetrical waviness is characteristic of the non-uniform velocity of sun and moon as they pass through the azimuth circle. This is a result of the orbital geometry being tilted relative to earth's equatorial plane.
The temperature sensor is located inside of an insulated thermos bottle, which resides inside a 5 gallon insulated chamber containing several pounds of liquid water as thermal ballast.
The 5 gallon chamber is contained inside an 2ft x 3ft x3ft insulated thermal chamber which has active temperature control, maintained at +- 0.1C.
This large thermal chamber is located inside a room which is maintained at +-2C.
In combination, the temperature controlled environment, thermal isolation and ballast are sufficient to prevent heat energy from flowing very fast, and thus provides a very long thermal time constant (on the order of weeks for a 0.05C change).
Mathematically, this thermal stability should prevent any temperature modulation like that indicated in the image above.
This result, as well as other collected data, has led me to the conclusion that there is gravitational modulation of the D101 temperature sensor- either through gravitational heating of the internals of the device, or more likely through stochastic modulation of the temperature sensor circuitry.
Read more on this stochastic/probabilistic effect in other blog posts.
Investigate Explore Imagine
© 2024. All rights reserved.