Tri-Axial Device
Simultanous measurement of 600Mhz oscillator noise coherence in three dimension.
Dwayne Esterline
6/28/20243 min read
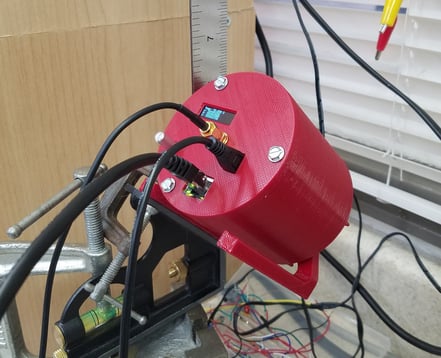
So here we have it, the next generation of 3-axis measurement.
In this device, I have used three Teensy 4.1 microcontrollers, each operating at a 600Mhz clock rate. The devices are programmed to utilize their internal clock rate as a timing device, so each unit provides a true clock with 1.67 ns resolution.
By making careful use of their hardware interrupt capabilities, I was able to devise a "Stopwatch" that can time an input signal very precisely. In this case, the input signal is a 1pps signal from a GPS module. The GPS antenna signal is routed into the device via shielded coax cable. The 1pps GPS output is separated into three equal length leads, one leading to each of the microcontrollers. Thus, each microcontroller is measuring the elapsed time between subsequent pulses of the exact same signal (at least as exact as I can achieve).
GPS signals have various forms of jitter, and the 1 pulse per second (1pps) signal will vary in length. For my purposes, these variations are not particularly relevant, as they are masked by the fact that each processor is measuring the same signal, and I am only interested in the difference in time measurement as measured by each of the processors (differential measurement). If there are step changes in the length of the GPS signal, then all three processors should measure the same step change +- their differential. (in fact, this is what was achieved- see video).
Each timer is triggered by the rising edge of the GPS signal, which happens very fast (under 4ns rise time, per my oscilloscope).
If each microcontroller clock had an identical , and perfectly stable frequency of 600Mhz, then we would expect the measured pulse length to be equal. If we were to plot this in a 3D scatterplot, then we would expect to see one single dot located at the nominal center (assuming 600Mhz is center of plot), with all measurements overlapping. In the case of GPS step changes, then we would see single dots spaced at an interval equal to the GPS step change, with all three measuring the exact same step change (in fact we do- 10ns shifts in data point groups due to 100mhz GPS oscillator resolution).
What is the expected outcome if the microcontrollers were perfectly stable, but had slight frequency offsets from one another? In this case, each axis would have a slightly different measurement, but stable. If we were to plot this outcome in 3D, then we would also see one single dot, but offset in x/y/z axis from the nominal center based on the new coordinates generated by slightly different measured time lengths from each processor.
In fact, the microcontroller clock crystals are neither identical in frequency, nor are they stable. Instead, they have 'noise' in their frequency, speeding up and slowing down slightly, and continuously. The noise generally takes on a Gaussian distribution when we evaluate one oscillator independently. In this case, we will have three independent oscillators producing slightly different random measurements (due to noise), and each having an average offset from nominal (due to unmatched center frequency). If we plot this as a 3D scatter-plot, what should we expect to see?
If the oscillator noise is independent, then we should expect to see a Gaussian point cloud in three dimensions, with the center offset to some xyz coordinate that matches the center frequencies of each oscillator.
If the oscillator noise is not independent, then we should expect to see a pattern within the point distribution--- which is exactly what was measured! (See attached video).
So, it appears that the oscillator noise is actually correlated across independent oscillators in three dimensions.
Looking carefully at the output, we see collinear structures (needles) that are grouped into cubic spaces, and we see offset pattern spacing that matches the 10ns step expected from the GPS clock. The collinear needles are linear groups of xyz measurements that are "jittering up and down" a linear path in a coordinated way. The small spacing between the needle groups is equal to the 1.67ns clock resolution, and is expected.
What seems to be a big surprise is that the noise within three independent oscillators is coordinated- i.e not independent after all. The video demonstrates coordinated rotation of the 'needle' pattern, requiring that each of the three independent axis must vary in an amount that is geometrically proportionate, and follows a set of trigonometry rules. X/Y/Z axis are all varying proportionately, and maintaining a linear distribution along the axis of the needle like distribution pattern.
More research is required, but early results seem to indicate that the oscillators are bound together by some coordinated means (gravitational jitter?).
Investigate Explore Imagine
© 2024. All rights reserved.